
Screenshots


About Luminograph
Luminograph is an offline color-science studio for designers, photographers, and print students. Explore chromaticity, compare display and print gamuts, convert encodings, simulate mixes, and check contrast — with short reference articles beside every instrument.
CIE CHROMATICITY
Interact with the CIE 1931 xy diagram. Overlay RGB gamuts used in photography, displays, and print workflows, and see where primaries sit against the spectral locus.
COLOR SPACE CONVERTER
Translate between HEX, RGB, HSL, HSV, Lab, XYZ, and CMYK. Adjust channels and watch values update together for quick study and design checks.
KELVIN & WHITE POINTS
Explore correlated color temperature along the Planckian locus. Probe daylight-oriented white points used in photography and color management.
GAMUT COMPARISON
Compare relative coverage of common RGB spaces and visualize how sRGB, Display P3, Adobe RGB, and related triangles differ on the CIE map.
MIXING BENCH
Simulate additive RGB light mixes and subtractive CMY ink mixes to build intuition for displays versus print.
WCAG CONTRAST PROBE
Measure text-to-background contrast ratios against accessibility guidelines for readable UI and editorial layouts.
STUDY VAULT
Save color studies locally as device-only files. No account required.
COLOR LEXICON
Short reference notes on CIE xy, gamuts, CCT, Lab, CMYK, additive RGB, WCAG, and white points — tied to the tools in the app.
PRIVACY
No account. No analytics SDK. Core tools work without a network. Preferences and studies stay in the app sandbox; uninstalling removes them.
Note: Luminograph is an educational visualization toolkit. It is not a color-managed soft-proofing station, spectrophotometer, or ICC profile editor. On-device displays vary — treat diagrams as learning instruments, not press or camera certification.
AVALW Coverage
Not yet mentioned in AVALW articles.
Similar apps
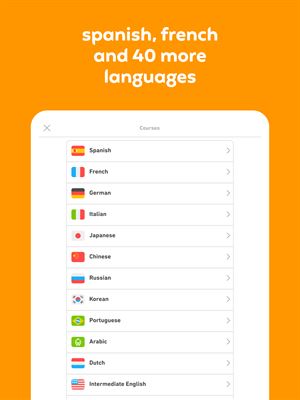
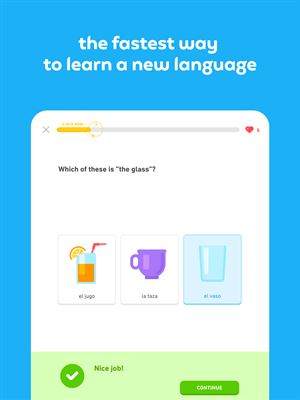
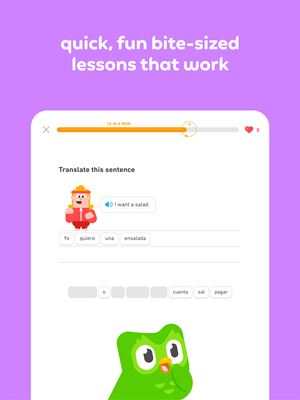
 Duolingo - Language LessonsDuolingo Inc.Learn a new language with the world’s most-downloaded education app! Duolingo is the fun, free app for learning 40+ languages through quick, bite-sized lessons.★ 4.7 5492k


 Duolingo: Language LessonsDuolingoLearn a new language, chess & more with the world's most downloaded education app! Duolingo is the fun, free app for learning 40+ languages through quick, bite-★ 4.7 5492k


 Read Along by GoogleGoogle LLCLearn to read with the magic of your voice and a friendly reading buddy★ 4.6 5287k


 Brainly: AI Homework HelperBrainlyQuick Math Helper & Science Solutions | Get Homework Answers for School Doubts★ 4.5 4470k


 Gauth: AI Study CompanionGauthTech Pte. Ltd.Ask anything, get right answer★ 4.8 2111k


 Remind: School CommunicationParentSquareRemind is a communication platform that helps every student succeed. Whether you're in the classroom, at home, or anywhere in between, Remind makes it easy to s★ 4.8 1799k


 Memrise: Fun language lessonsMemriseImprove vocabulary & learn to speak English, Spanish, German, Japanese & more!★ 4.4 1571k


 ClassDojoClassDojoClassDojo connects teachers, tutors, kids, and families★ 4.8 1341k